In 2024, finding the right web analytics tools is key to understanding your site visits. Yes, old-style numbers tell you who comes and goes. Yet, they miss out on why folks act as they do online.
Table of Contents
This gap makes it tough to improve their time on your site. You see where people leave but not why without more insights like thoughts or reasons behind actions. Without this type of info, fixing what’s wrong in user experience (UX) takes a lot of guesswork and tests.
5 Must-Have Features of Web Analytics Tools
As we dive into major categories like content and customer analysis or UX insights alongside testing variations with A/B procedures and peeping at social media impacts, understanding these pillars is vital. Also crucial are SEO influences plus broad enterprise needs down to specific product behaviors.
Let’s unravel which key traits make certain tools stand out for pinpoint precision in tracking visitor behavior and trends over time.
Real-Time Data and User Behavior Insights
In real-time data and user behavior insights, you get instant feedback on how people interact with your content. This shows what’s working right now by tracking every move users make. It lets teams see both live and past data in one place, sorting it easily by type or source.
Unlike old methods that looked at simple numbers like bounce rate, this focuses on “engaged minutes.” That means it tracks active reading time, a solid sign of interest. It also gathers info from places outside your site: social networks (like Facebook), search engines (Google included), plus various platforms such as mobile apps and others for a full view of performance.
Integrated AI for Predictive Analytics
Integrated AI in web analytics tools brings a powerful forecast edge. It looks at past data, like page views and paths visitors took. This predicts future actions, such as which pages will see more visits or where users might drop off.
This isn’t just guessing. It’s based on patterns found in large amounts of collected data. So, you get smart about what changes to make for better results later on. Think less bounce rate because you know where to improve or higher conversion rates as you could predict the next big trend your visitors love.
Customizable Dashboards and Reporting Features
Customizable dashboards let you see big data in simple views. They mix key facts so your team makes smart choices fast. Think of it as a single place to watch all vital signs of your work’s health, updated without waiting for slow reports.
This feature helps everyone understand what needs attention right away and where things are going well. With these dashboards, say goodbye to old charts on paper or screens full of endless rows that make finding insights hard. Instead, enjoy easy-to-read visuals that tell you what’s up now – not weeks ago.
Dashboards can also warn you when something odd pops up. For those who manage projects or teams, this means less time digging through numbers and more focus on actions that help the business grow strong.
Comprehensive Conversion Tracking Capabilities
To truly grasp what makes your website click (or not), diving into comprehensive conversion tracking is key. Tools like Smartlook and Hotjar are at the forefront, offering a blend of behavior analytics and visual insights. These platforms let you see beyond just clicks, giving an in-depth look at user experience through session replays and heatmaps.
This way, understanding why visitors act as they do becomes clearer. You’ll track actions such as clicks or page views automatically – no extra coding is needed on your part. Watching how users move within your site helps pinpoint issues fast, and finding sessions where frustration occurs is straightforward, with over 30 filters for specific needs.
Cross-Platform and Device Compatibility
Your web tool must work well on all gadgets and systems. Imagine you’re using both a phone and a computer to check your site’s data; the experience should feel smooth on each. This feature lets team members from different places use the same info without trouble, making decisions faster.
Also, as people visit your website from various devices, understanding their journey becomes simpler with this compatibility in place. By ensuring seamless access across platforms, you boost efficiency in analyzing trends and optimizing strategies for better reach among diverse users.
1. SEMRush
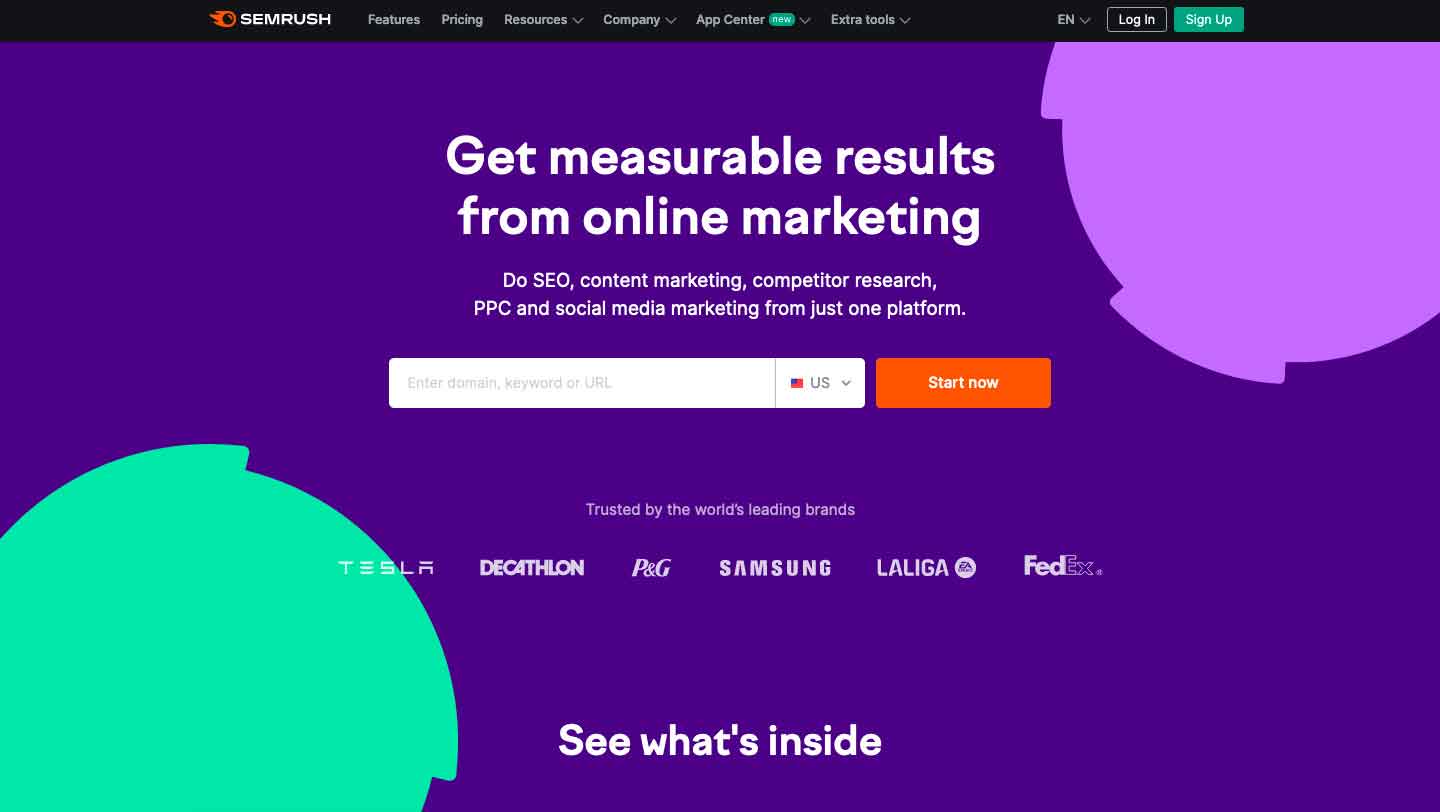
In SEMrush’s world, mastering market analysis becomes easy. This platform shines in SEO analytics unlike any other tool listed.
With SEMrush, tracking traffic structure and visitor insights, including device usage, is straightforward. Plus, it excels in competition analysis and campaign performance evaluation without demanding advanced technical knowledge from its users.
Additionally, SEMRush has evolved beyond basic traffic data collection; offering features such as session recordings for understanding user engagement on a deeper level along with heatmaps that visually map out where clicks occur most frequently within your site. Conversion funnels are also part of this robust toolkit: capturing critical pathways visitors take toward conversion helps tweak marketing strategies effectively.
By integrating custom event tracking alongside surveys and polls into their suite, SEMRush facilitates direct communication with customers, ensuring businesses not only track but also engage meaningfully with their audience based on actionable feedback collected through these interactive tools.
2. Algolia
Algolia’s Merchandising Studio now includes a Comprehensive Events Retention feature. This lets merchandisers view data on years of past events. It’s key for spotting seasonal trends and planning accurately. A new Comparison Mode gives side-by-side result views as settings change, offering clear control over search outcomes.
Furthermore, Algolia introduced Data-Driven Personalized Recommendations. These tailor product suggestions to each shopper, potentially boosting cart adds with ‘Recommended for You’ lists. The Image-Based Recommendations mimic in-store shopping online by suggesting products based on visual similarity, enhancing the browsing experience significantly.
Soon, AI Attribute Enrichment will auto-add attributes to all SKUs, improving SEO and user experiences markedly while simplifying catalog management. Lastly, the Merchandising by Group option allows precise digital storefront curation, directly impacting how products are displayed site-wide.
3. Adobe Analytics
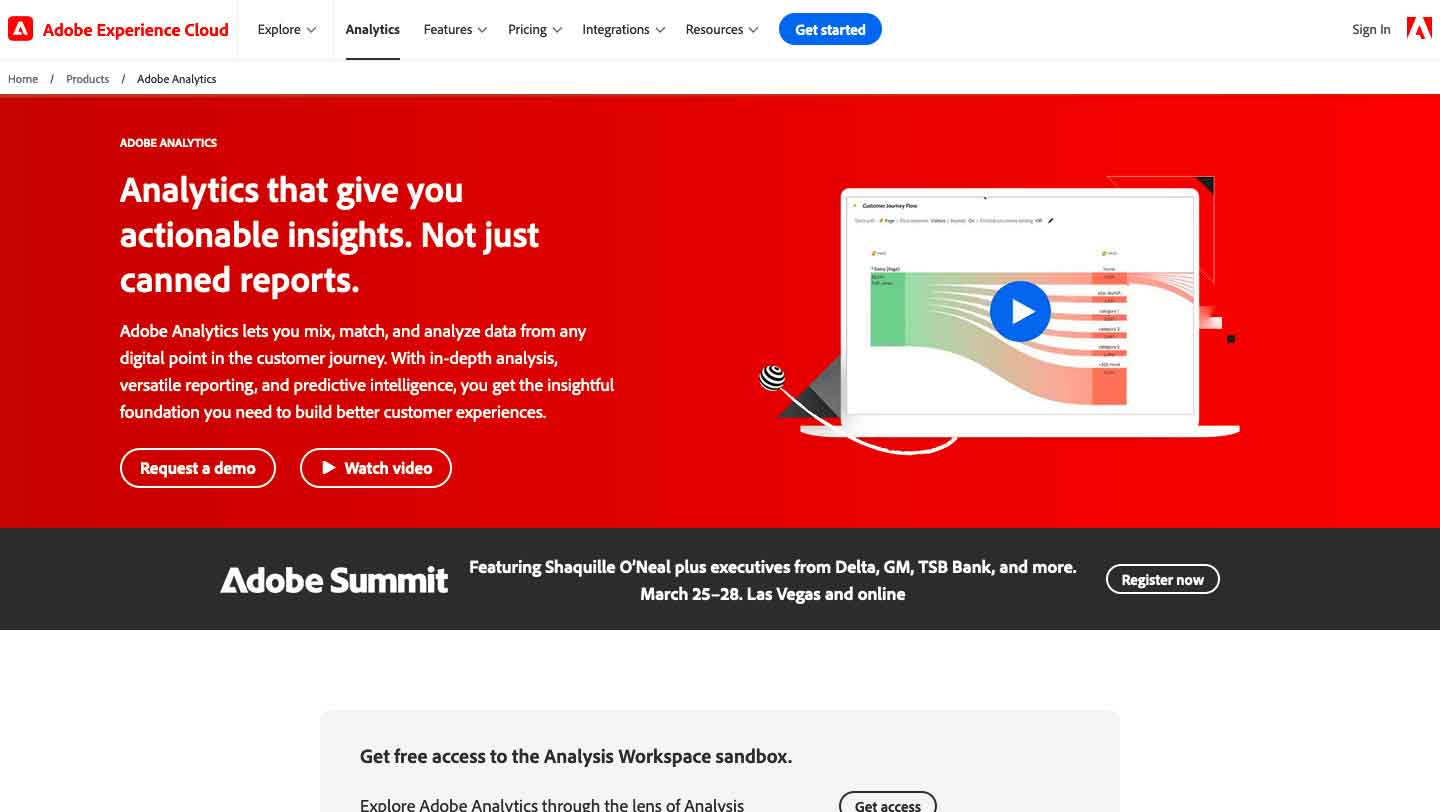
Adobe Analytics, like Omniture, lets you see how customers use your online spaces. Since 2012, it has made understanding customer actions simpler. By tracking interactions with sites and ads or even offline activities impacting online behavior, Adobe Analytics provides a full picture in one spot.
You get to visualize and predict what customers might do next. Its toolset includes easy tag management via the Adobe Experience Platform Tags and data collection from various sources—enabling detailed comparisons of different customer groups through cohort analysis. Its anomaly detection digs into why things change. Yet there are trade-offs: its setup is complex: help from specialists is often needed; costs start at $500 monthly for basic access; not designed following HIPAA rules.
Customer Journey Analytics (CJA) by Adobe takes it further, integrating across all channels a customer may interact with linked directly through the centralized hub of the Adobe Experience Platform.
4. Microsoft Clarity
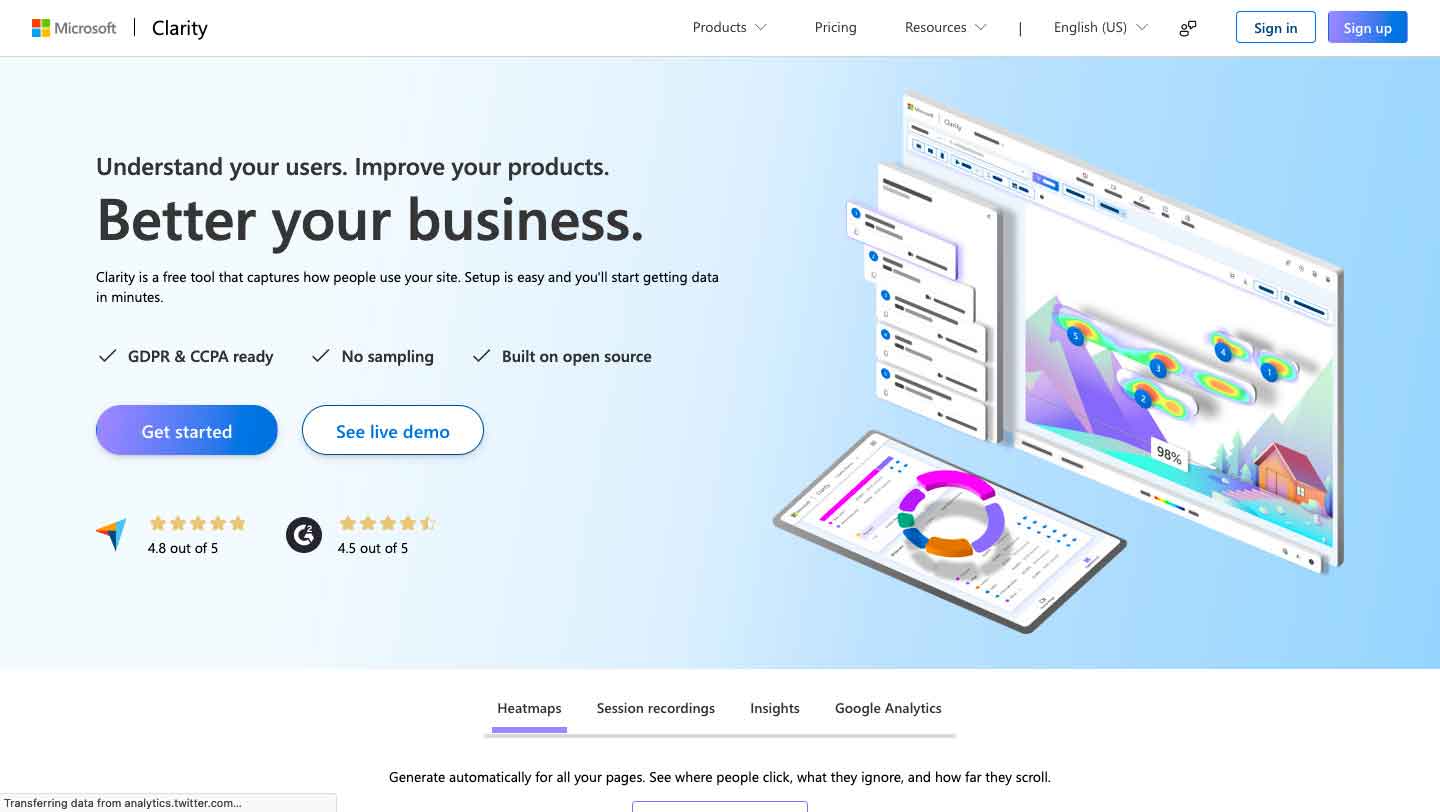
When you tap into Microsoft Clarity for real-time data, it’s like unlocking a secret door to your website’s true potential. By tracking how visitors interact with your pages – through clicks, scrolls, and mouse movements, you gather insights not just on where they go but also on why some may leave without converting.
Imagine finding out that many users abandon their carts at the checkout stage. With this detailed insight from UX analytics tools such as Clarity, pinpointing issues becomes simpler. For instance, maybe the process is too complicated or lengthy.
Armed with this knowledge, you can make targeted changes to streamline these processes fully. This doesn’t just enhance user satisfaction.
Incorporate Plerdy and Clarity for deeper behavior analysis. Use form analytics and other metrics for insights. This approach optimizes the visitor journey. There’s no guesswork, only actionable data.
5. Hotjar
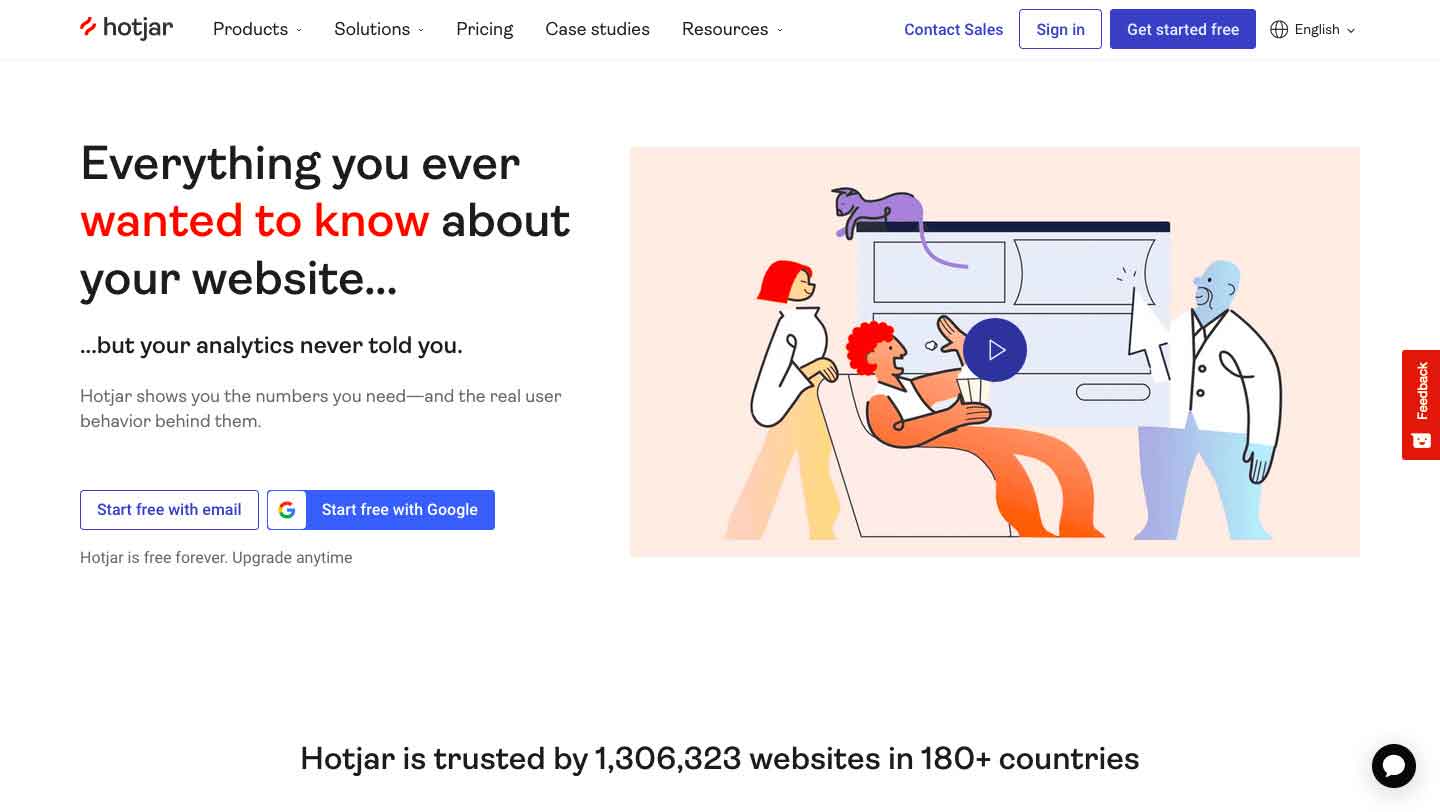
Hotjar stands out by making user behavior clear. For ecommerce sites, understanding this is key to keeping customers around longer. Using Hotjar’s WordPress plugin makes it easy for website owners to start analyzing visitor actions quickly.
By learning from real feedback and watching where visitors click or get stuck (rage clicks), you can make changes that improve their experience. Businesses benefit greatly from listening to negative feedback through Hotjar, too. It guides them in refining products or services based on the actual needs and frustrations of users.
6. Tableau Online
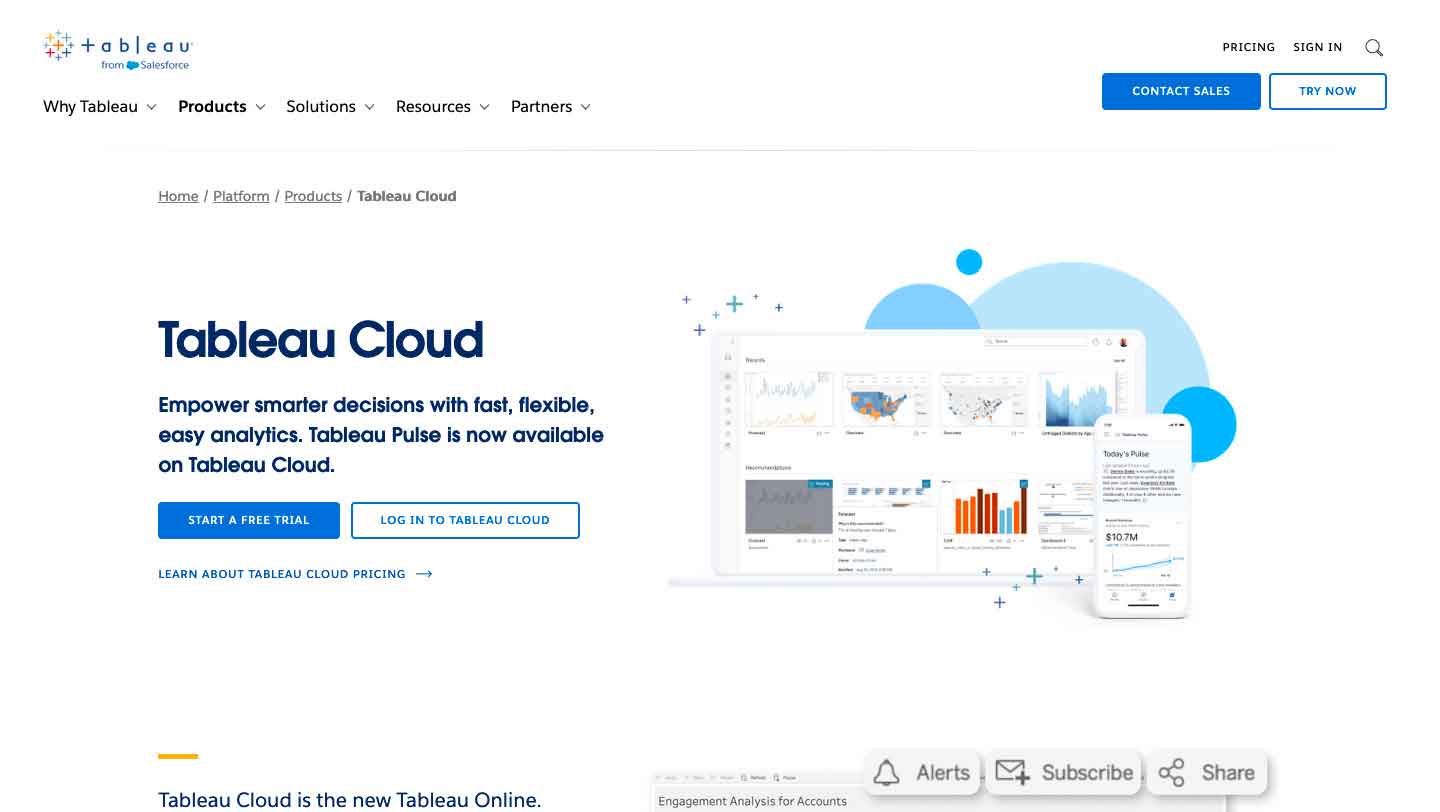
In your quest to boost blog performance, Tableau Online emerges as a powerful ally. It streamlines analytics by showing only what matters most to you and your stakeholders, cutting through unnecessary data noise.
With options for real-time analysis and historical trends tracking across multiple blogs or clients, comparing performance becomes straightforward under Tableau’s lens.
Choosing this platform means opting for an all-in-one solution tailored for ease without sacrificing depth—ideal for those aiming at comprehensive yet uncomplicated analytics insight into their web presence.
7. Crazy Egg
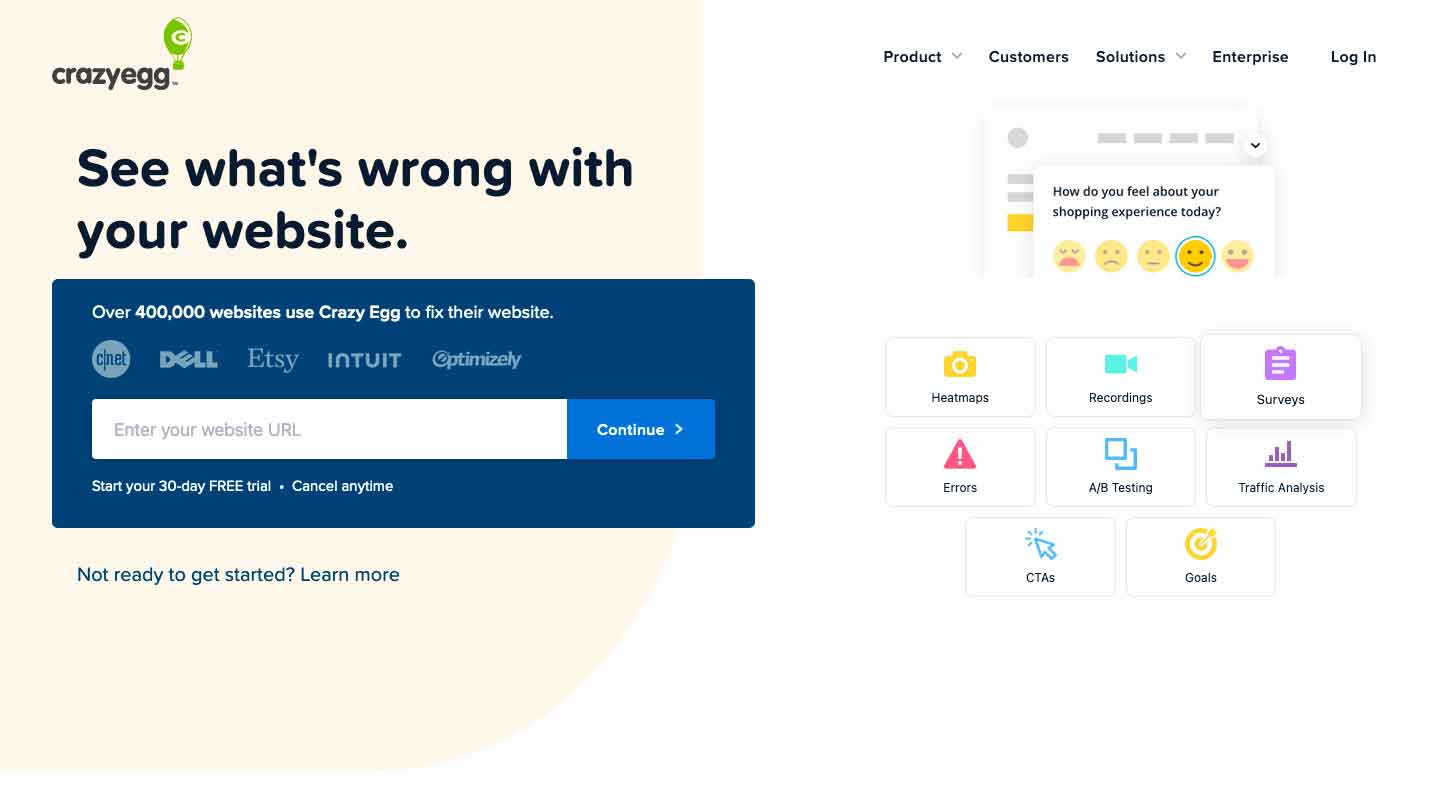
Crazy Egg tools shine in optimizing conversion rates. They track how visitors use your site, revealing what works and doesn’t. You learn where users click, scroll, and stop engaging. With this data, tailor your pages to boost conversions by strengthening areas that hold visitor interest and revising sections they ignore. Crazy Egg’s heatmaps are particularly valuable for visualizing on-site behavior; you clearly see hotspots of activity versus ignored spaces.
Moreover, understand traffic sources with precision using Crazy Egg’s analytics capabilities. Identify which channels bring the most valuable visitors who actually convert rather than just browse. Combine these insights with knowledge about customer demographics plus psychographics from integrating CRM software for a thorough understanding of why people buy or leave without purchasing. Customize campaigns effectively to increase engagement right at the crucial points.
In essence, leveraging Crazy Egg within your web analytics suite ensures no guesswork but informed strategies backed by concrete user interaction data, a must-have tool for serious marketers aiming high in today’s competitive digital landscape.
8. Woopra
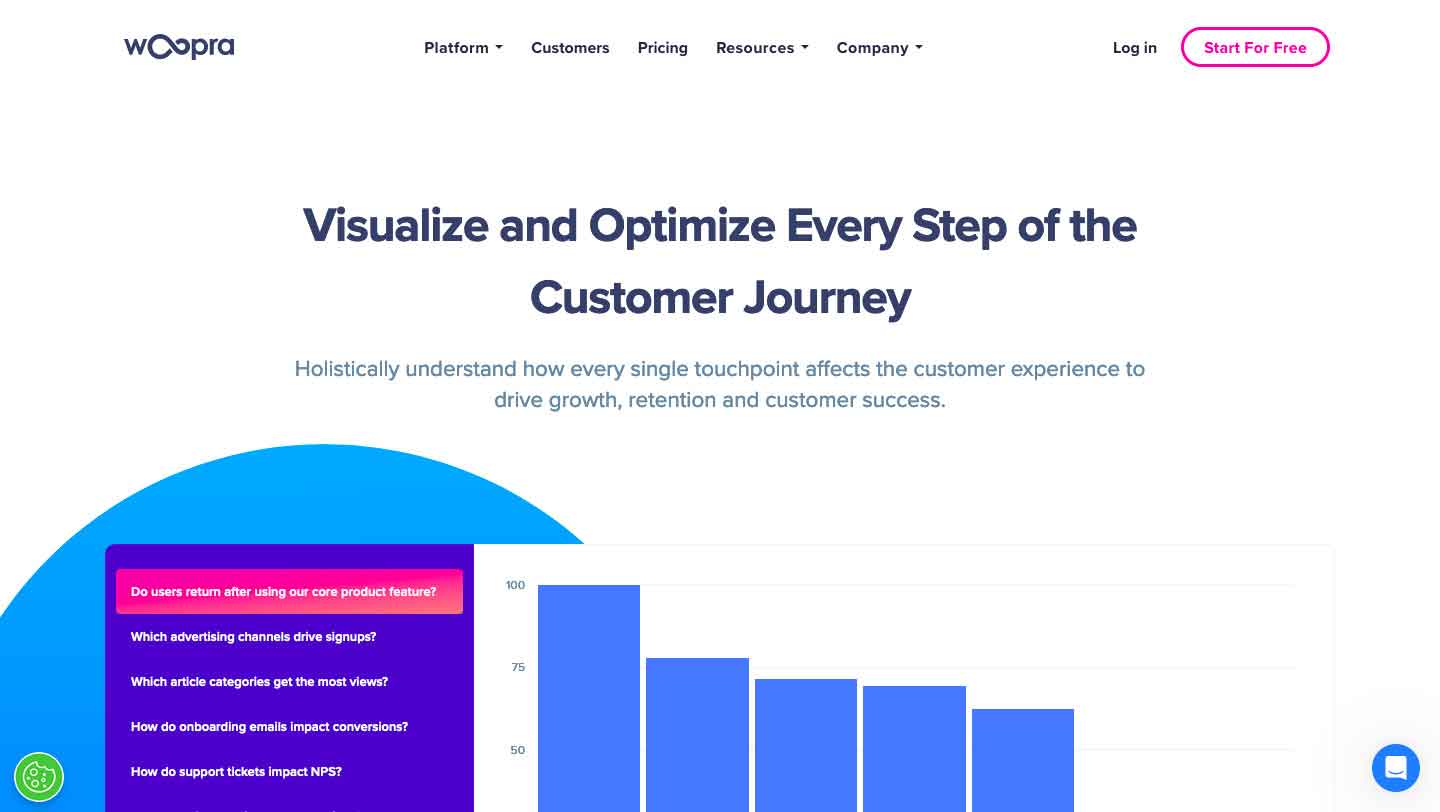
Woopra is key to boosting your e-commerce plan. It tracks user actions from many sources in one spot. This includes ads, social media, emails, and more.
With tools like Google Ads or Shopify tied to Woopra, you see all customer activity. Once someone signs up on your site, Woopra makes a unique profile for them. This links their details to every interaction with your brand across devices. For analysis, Woopra offers reports on user journeys and trends, plus custom segments based on behavior.
So, if a Facebook ad leads customers to sign up via email and buy after seeing another campaign? You can track that path in detail. Woopra shows which campaigns work best by linking sales back to initial marketing efforts, which is vital for growing revenue smartly.
9. Google Analytics 4
As we dive into web analytics tools, Google Analytics 4 (GA4) stands out. It’s a blend of Universal Analytics and Firebase aimed at providing deep insights through machine learning. Since its launch, GA4 has introduced significant advancements over previous versions.
Its core strengths lie in enhanced data controls and the ability to track multiple conversions per session for identical events – a leap from the traditional conversion count. Importantly, GA4 offers better cross-domain tracking and defaults to data-driven attribution over the last non-direct click methods. These features are critical as businesses vie for visibility amidst fierce competition online.
Adopting GA4 isn’t just following an upgrade trend. It’s about harnessing more refined tools for clearer analysis. The migration process is outlined by Google: starting with creating or converting an account towards setting up tailored property configurations. Moreover, verifying live data collection via real-time browsing proves straightforward yet pivotal in ensuring successful setup completion.
10. Plausible Analytics
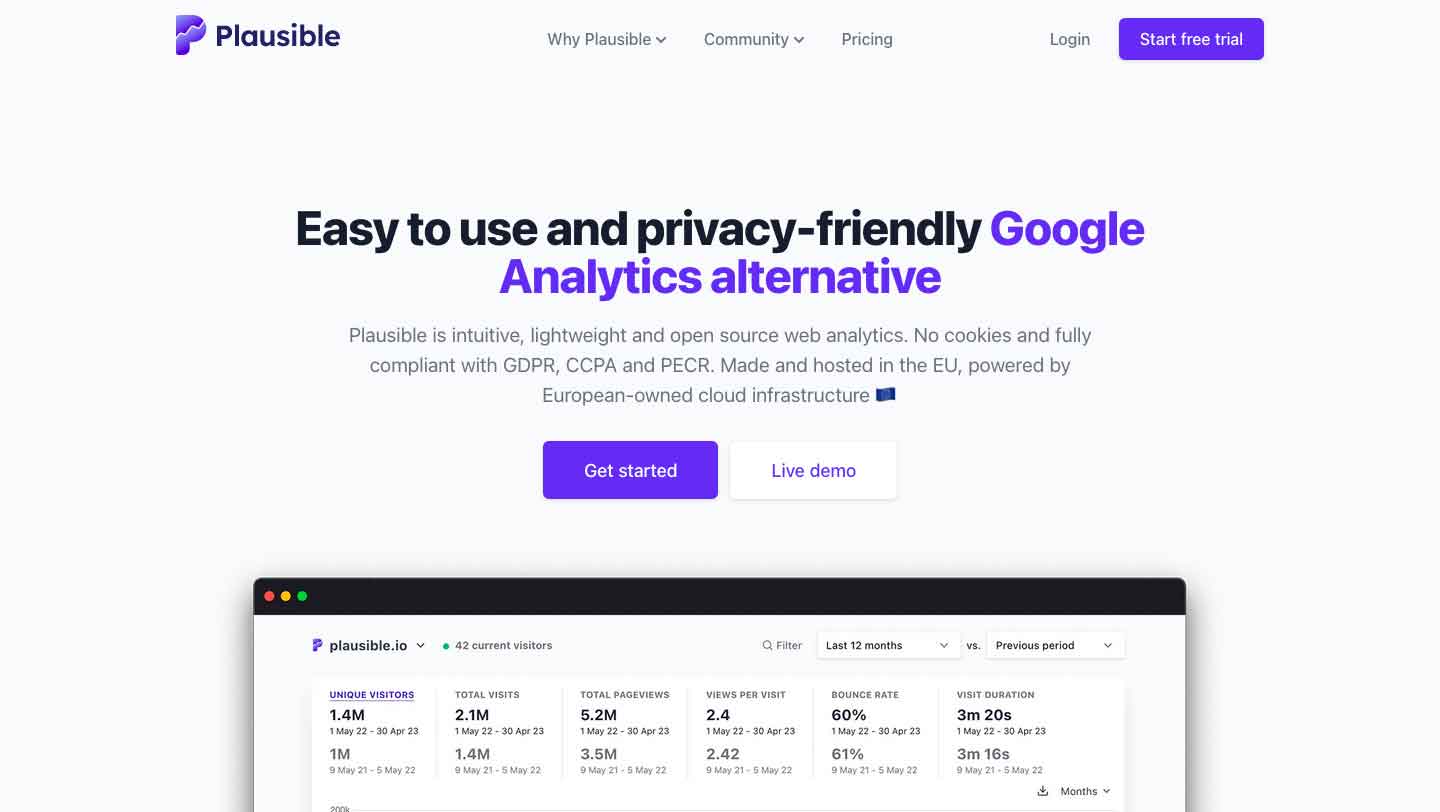
Plausible Analytics is a game-changer for site owners who value simplicity, speed, and privacy. First off, it’s user-friendly. Importing stats from Google Analytics is straightforward, too. Its script size impresses me the most: 45 times smaller than Google’s offering!
This means faster loading of websites and less environmental impact, with up to 4.5 kg of CO2 saved annually for sites with around 10,000 visitors. Privacy-wise, Plausible respects visitor data by not using cookies or collecting personal details, eliminating the need for consent banners under GDPR rules. For analysis depth, it doesn’t disappoint either. A click lets you delve into metrics like audience segments or referral sources, effortlessly tracking revenue growth campaign goals and even file downloads without invading users’ privacy.
You can also invite team members to review your dashboard, which streamlines collaboration. Better yet, making these stats public via a link encourages transparency, an aspect increasingly valued in today’s digital landscape.
Choosing the right web analytics tool in 2024 is key. Each option serves different needs well. Some offer deep insights, which are perfect for big sites with lots of data. Others are simple and easy, great for new users or small businesses. Look at what you need most: Is it real-time data, user path tracking, or integration ease? Pick a tool that matches your site’s size and goals best from the top ten list we discussed earlier.


